The dashboard
Ten pages, one look, at /_wizelens on every service, the hub, and the cloud.
Pick a time range in the top bar. Every number compares itself with the range before it. Search everything with Ctrl K (⌘ K). Light and dark themes are built in.
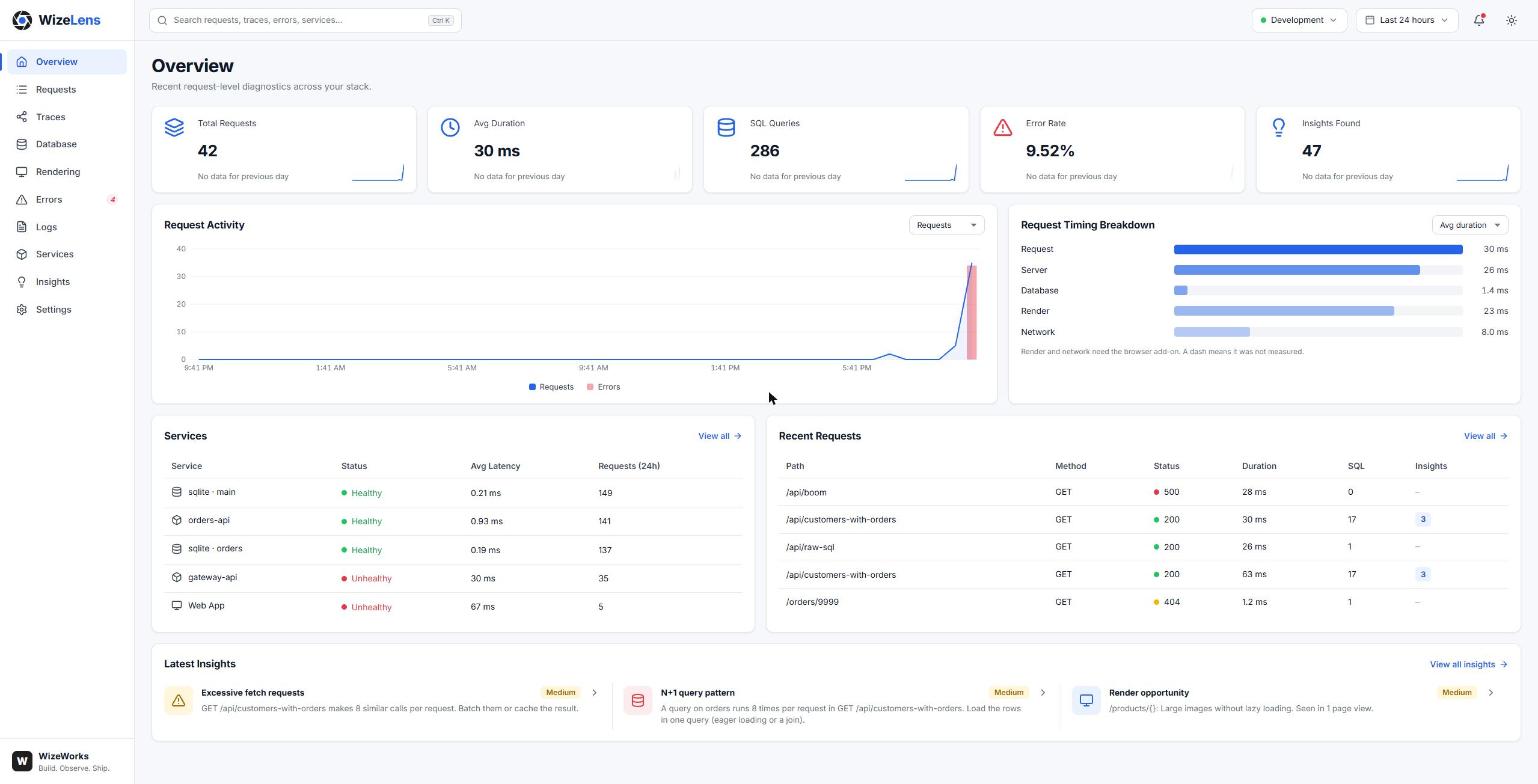
Pages
| Page | What you get |
|---|---|
| Overview | Requests, duration, SQL, error rate, and insights at a glance; request activity, timing breakdown, services, recent requests, latest insights |
| Requests | Filter by method, status, duration, service, or text; export to CSV; a side panel with summary, headers, response, tags, and timing |
| Traces | One request as layers: browser, network, routing, handler, each service, each database, render. Plus bottlenecks and the slowest spans |
| Database | Slow queries over time, time per operation, top slow queries, table hot spots |
| Rendering | Render time per route, SSR, hydration, image loading, layout shift, and the React components that render too often |
| Errors | Exceptions over time, top types, errors by service, and the stack trace and request of each one. Browser errors too |
| Logs | Every log line from every service, filtered by level, service, or text |
| Metrics | CPU, memory, GC, request times, and your own counters per service, as charts; split by any attribute |
| Services | Health of each service, database, and outside host, and a map of who calls whom |
| Insights | Every N+1, duplicate query, slow query, and render problem, ranked, with how to fix it |
| Settings | How each connected service is set up, and your dashboard preferences |
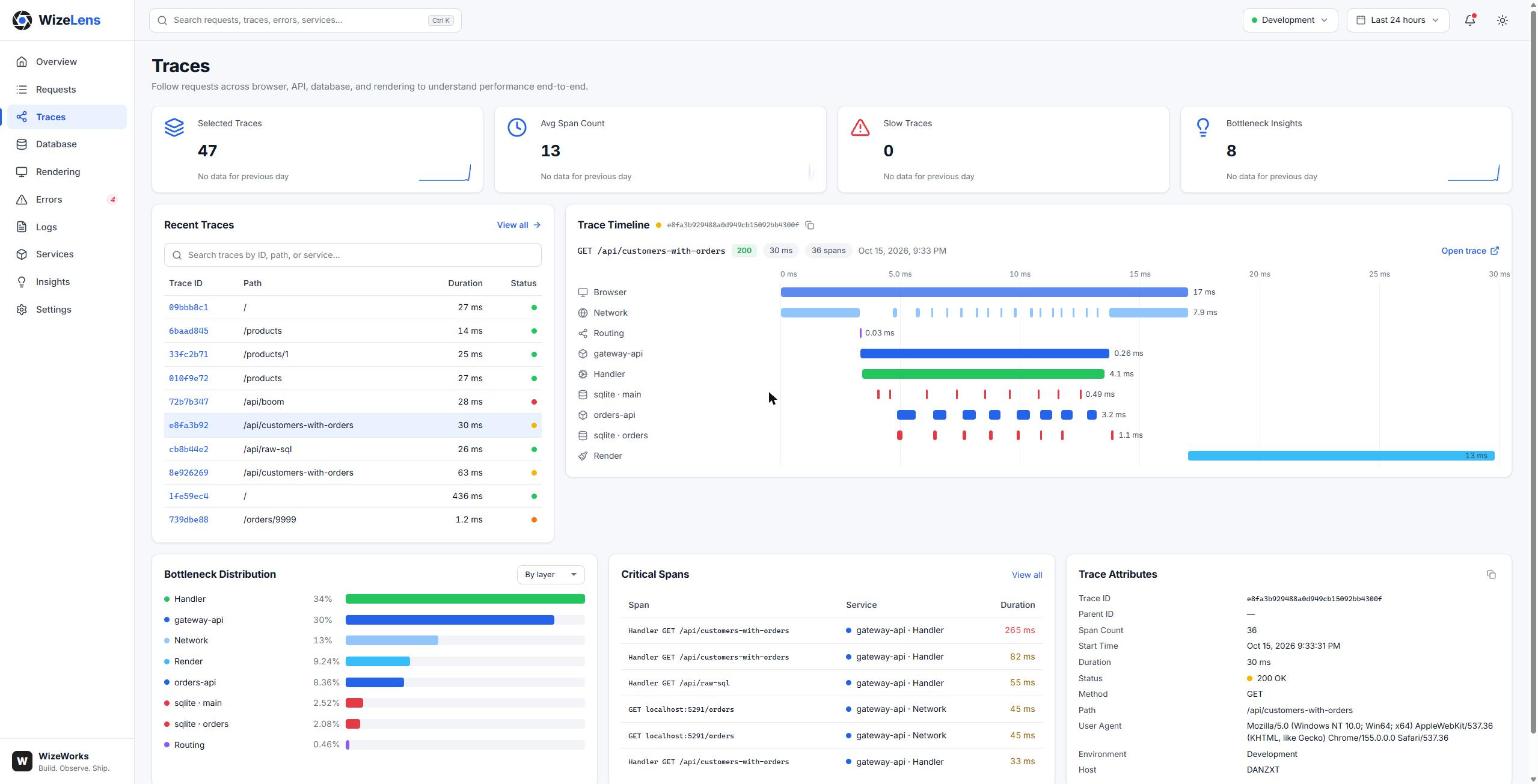
One trace
Open any trace for the full detail: the timeline, SQL, HTTP calls, logs, and errors, across every service it touched.
Time
Database and outgoing times are wall time: spans that overlap count once, so a request never shows more database time than server time. When queries ran at the same time, "all queries added up" is shown next to it.
How far back
| Running | Ranges |
|---|---|
| In your app | Up to 24 hours (newest 2,000 traces) |
| The hub | Up to 7 days |
| The cloud | Up to 30 days, computed on the server |
Ranges longer than the host keeps are hidden.